Mathematics - Class ...

Topic outline
-
Math – Class 2/Grade2 – CBSE – Chapter Data Handling (Pictograph) - Questions and Answers/Notes/Worksheets PDF, Tags: Pictorial representation or pictograph for class 2, Mathematical data, Pictures or symbols to represent the collected data, Organizing data using pictorial representation IInd grade, Reading pictograph table for second grade, Pictorial representation of data for kids, Pictorial representation of data for grade 2, Data handling for second grade, Data handling worksheet PDF, Graphical representation of data, Data handling exercises.
-
Data Handling
Pictograph
Many times we use picture or symbol to represent quantities of objects. Such representation is called pictograph. Pictograph makes information easy and clear to understand. Information that we collect is called data.
Reading of Table
Example 1: Aditya decided to conduct a study on most popular car color. So he stood outside his house and recorded the observation about 50 cars passed from there.
This was what he observed.
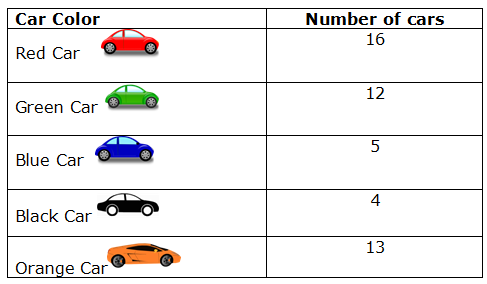
Now, read the above table and answer the following questions:
Q1. How many cars did Aditya count?
Ans. 50
Q2. How many blue cars did Aditya count?
Ans. 5
Q3. How many green cars did Aditya count?
Ans. 12
Q4. What is the most popular color car according to his observation?
Ans. Red Car
Q5. What is the least popular color car according to his observation?
Ans. Black Car
Reading of Pictograph Table
Example 2: Ria interviews 20 people and asks them which ice-cream flavor is their favorite. She made a pictogram with the details she gathered:
Here is what she found.
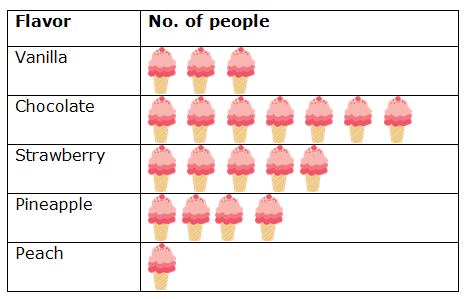
Now, read the above table and answer the following questions:
Q1. Which ice cream flavor do you think is most popular choice?
Ans. Chocolate
Q2. Which ice cream flavor do you think is least popular choice?
Ans. Peach
Q3. How many people chose vanilla as their favorite ice cream flavor?
Ans. 3
Q4. How many people chose peach as their favorite ice cream flavor?
Ans. 1
Q5. Which ice cream flavor does you like the most?
Ans. Answer will vary
Example 3:
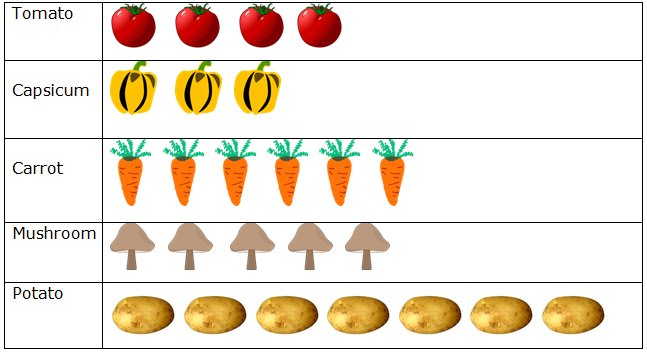 Now,
read the above table and answer the following questions:
Now,
read the above table and answer the following questions:Q1. How many tomatoes are there?
Ans. 4
Q2. Which kind of vegetable is maximum in number?
Ans. Potato
Q3. Which kind of vegetable is minimum in number?
Ans. Capsicum
Q4. What is the total number of vegetables?
Ans. 25
-
-
-