Mathematics - Class ...

Data Handling - Questions
Completion requirements
Practice Page 1
|
Q1.The following table shows daily production of chocolates in a factory for 7 days of a week. Represent this information through a pictograph.
Hint: Draw 1 whole Chocolate for 100 chocolates and draw 1/2 Chocolate for 50 chocolates
|
Practice Page 2
Q1.The following graph shows the favorite fruit of the students of grade 4.
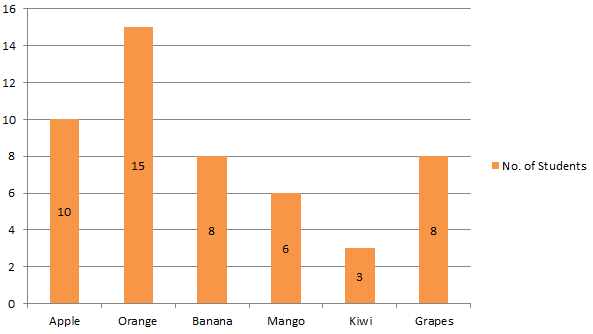
Now, answer the following questions:
Q1. How many students have grapes as their favorite fruit?
Ans. _________________________________________
Q2. Which fruit was chosen by most students?
Ans.__________________________________________
Q3. Which fruit was chosen by least students?
Ans. __________________________________________
Q4. Which fruits were chosen by equal number of students?
Ans. __________________________________________
Practice Page 3
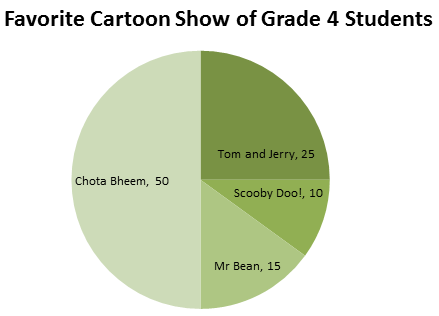
Q1.Study the pie graph, then answer the following questions.
Now, answer the following question :
Q1. Which is the most popular cartoon show among grade 4 students?
Ans. ___________________________________________________
Q2. Which is the least popular show?
Ans. ___________________________________________________
Q3. Which is more popular Chota Bheem or Tom and Jerry?
Ans. ___________________________________________________
Q4. How many students like to watch Mr. Bean?
Ans. ___________________________________________________
Last modified: Saturday, 15 December 2018, 2:35 PM